Note
Go to the end to download the full example code
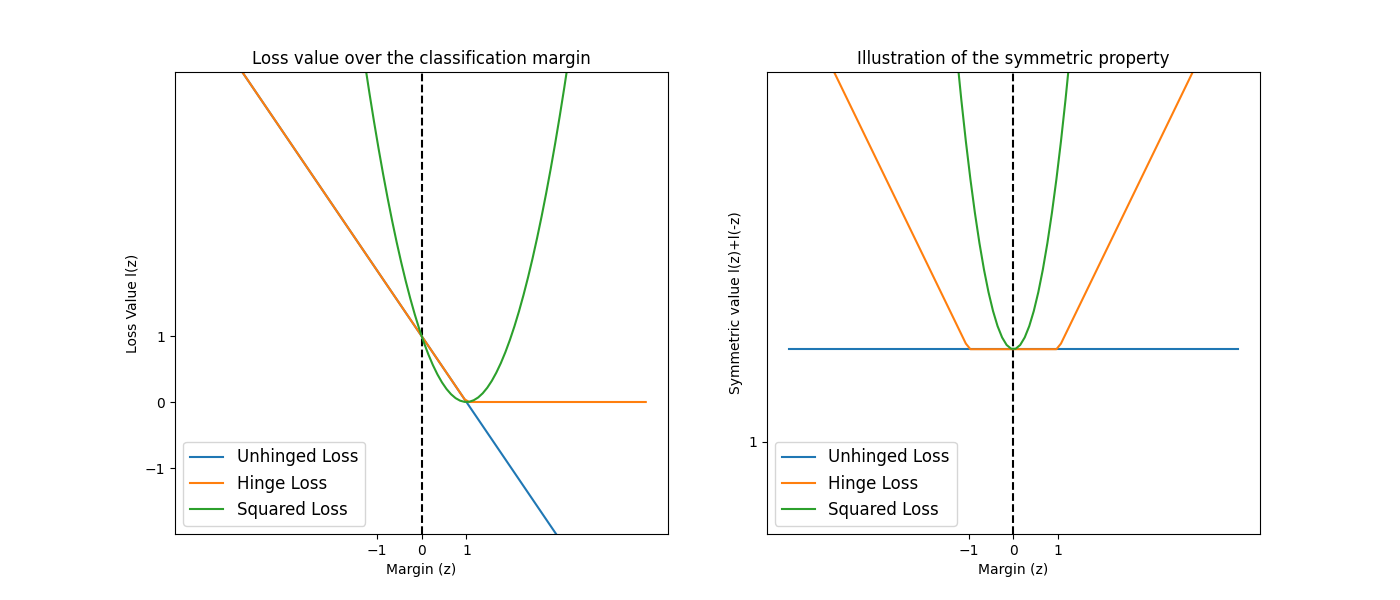
Symmetric Property of Loss Functions
This example shows the particular form of symmetric losses to learn robust classifiers from noisy labels, inspired from : “On symmetric losses for learning from corrupted labels.” by Charoenphakdee and al.
import matplotlib.pyplot as plt
import numpy as np


def squared_loss(y_true, y_pred):
    z = y_true * y_pred
    return (1 - z) ** 2, -2 * y_true * (1 - z)


def hinge_loss(y_true, y_pred):
    z = y_true * y_pred
    return np.maximum(0, 1 - z), np.where(1 - z > 0, -y_true, 0)


def unhinged_loss(y_true, y_pred):
    z = y_true * y_pred
    return 1 - z, -y_true


z = np.linspace(-5, 5, 100)

losses = [
    ("Unhinged", unhinged_loss),
    ("Hinge", hinge_loss),
    ("Squared", squared_loss),
]

plt.figure(figsize=(14, 6))

plt.subplot(121)
plt.axvline(0, color="black", linestyle="--")
for i, (name, this_loss) in enumerate(losses):
    plt.plot(z, this_loss(np.ones_like(z), z)[0], label=f"{name} Loss")

plt.xlabel("Margin (z)")
plt.ylabel("Loss Value l(z)")

plt.xticks([-1, 0, 1])

plt.ylim([-2, 5])
plt.yticks([-1, 0, 1])

plt.legend(loc=3, prop={"size": 12})
plt.title("Loss value over the classification margin")

plt.subplot(122)
plt.axvline(0, color="black", linestyle="--")
for i, (name, this_loss) in enumerate(losses):
    plt.plot(
        z,
        this_loss(-np.ones_like(z), z)[0] + this_loss(np.ones_like(z), z)[0],
        label=f"{name} Loss",
    )

plt.xlabel("Margin (z)")
plt.ylabel("Symmetric value l(z)+l(-z)")

plt.xticks([-1, 0, 1])

plt.ylim([0, 5])
plt.yticks([1])

plt.legend(loc=3, prop={"size": 12})
plt.title("Illustration of the symmetric property")

plt.show()
Total running time of the script: ( 0 minutes 0.274 seconds)